

Courtesy of Marcie Casas
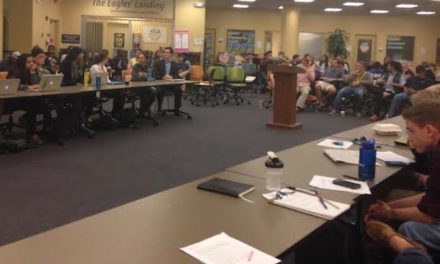
During the weekend of April 4, I had the privilege of spending my weekend with 27 undergraduates during Emory’s first ever DataFest, a weekend-long data analysis competition. DataFest originated at University of California, Los Angeles (UCLA) in 2012, and has since expanded to multiple universities, including Duke and Princeton. Emory’s DataFest was sponsored by the Institute for Quantitative Theory and Methods of Emory University, IBM Academic Initiative and energy conservation company GridPoint. Similar in spirit to the recent Emory Hackathon, where students competed in teams for more than 32 hours to produce a product in the form of software or an app, DataFest students competed in teams to provide insights into real and complex data. Given the new age of “big data,” the high demand in the workforce for employees with data analytic capabilities and the increasing presence of statistical analysis in all fields of academic research, this was a tremendous professional development opportunity for all students involved.
The data provided was from a real business with real questions to answer. GridPoint supplied information regarding 110 of their restaurant and retail clients from across the United States spanning 2006-2013, which was provided in five relational data sets with more than three million observations and nearly 80 variables. This real life data was rich in issues that students do not often get to explore in the traditional classroom setting – classrooms which tend to have tidy data sets with finite solutions. Different measurements were made before and after the installation of the energy management system by GridPoint, repeated measurements were made over time, there was substantial variation in energy use daily, monthly and geographically and, as expected, energy use was highly correlated to weather readings.
There were no prerequisites to enter the competition, and students came in with varying backgrounds and capabilities. Faculty and graduate student volunteers were on hand all weekend long to provide assistance, and guidance as students stumbled through uncharted data territory. Just as volunteers were represented from departments such as political science, mathematics and computer science, sociology and psychology, the student participants were also very diverse with majors in business, applied math, economics, psychology, anthropology, neuroscience and behavioral biology, computer science and many more. Diverse backgrounds strengthened teams by providing different perspectives on problem solving approaches and taught students how to collaborate with others outside their area of expertise, accurately mimicking a real-world experience.
For example, in my previous employment at the Centers for Disease Control and Prevention, identifying solutions to control the spread of a disease would often involve discussions between a biostatistician (myself), an epidemiologist, an entomologist and a medical doctor. Communicating with experts in different fields is more challenging than it may appear on the surface – while I needed to understand the disease process in order to appropriately analyze the data, I also needed to effectively explain statistical results to the team in order to create recommendations together. This collaborative and interdisciplinary process was evident in DataFest, as all teams approached the analysis from different angles and discovered unique insights in energy expenditure. No matter their skill level, all students made tremendous gains in their statistical and programming knowledge over the weekend. They also strengthened existing friendships, formed new ones and had the opportunity to interact with the volunteers and learn about how they use statistics in their research. Most importantly, everyone had fun. This was a low-pressure, low-risk environment for which the investigative process had no right answer – like assembling a jigsaw puzzle without edges where multiple pieces can fit together. An anonymous student review stated, “I loved it! I loved having the opportunity to focus on only one thing for two days and keep trying until I got it right. Our team didn’t win, but I learned a lot and was very proud of the work that we did.”
The value of this co-curricular event to the academic community was reflected in the judging panel, which consisted of myself, IBM representative Scott Pesses, Senior Lecturer in Psychology Nancy Bliwise, Chair of Political Science and Director of Institute for Quantitative Theory and Methods Cliff Carrubba and Dean of Emory College Arts and Sciences Robin Forman. Despite this formidable line-up, all of the students impressively presented their findings. Because of the high quality of investigation and research presented, the judges were all quite challenged to identify a winner. But, of course, you all know the clich̩ which rings especially true here Рall DataFest participants were winners in my mind.
On a personal note, while many professors may understandably feel the urge to hide from students over the weekend, I surprisingly found that spending my weekend with a group of students was energizing. Unfortunately, I do not often have the opportunity to engage with students on a personal level, given the large class sizes that I teach; I relish such experiences, and DataFest was incredibly refreshing. I am consistently impressed with the intelligence and dedication to academics of the Emory undergraduate student body in general, and I feel incredibly fortunate to teach at Emory and have the opportunity to introduce so many excellent students to the real world applications of statistics.
I am also nearly giddy pondering what DataFest 2020 will look like. The nation has experienced rapid growth in the number of statistics and biostatistics programs offered, and recently ‘data science’ has emerged as a formal discipline – Emory College is now too riding this wave. The newly created Quantitative Social Science major (beginning fall 2014) is uniquely on the forefront of curricular offerings at the undergraduate level as it develops quantitative skills by integrating statistical, mathematical and computational techniques with an applied area of interest.
Given this new major and the plans to eventually offer more elective courses in the Institute for Quantitative Theory and Methods, I suspect that the student body’s data analytic capabilities will be growing exponentially. But, for many students, this change has not been happening fast enough, as many have expressed frustration at the lack of general courses dedicated to applied statistical analysis. Until the university is capable of fully satisfying this demand, I am pleased that we can offer DataFest as a brief and intense (and wide-open!) window into the investigative process of exploring and analyzing complex data.
– By Shannon McClintock
The Emory Wheel was founded in 1919 and is currently the only independent, student-run newspaper of Emory University. The Wheel publishes weekly on Wednesdays during the academic year, except during University holidays and scheduled publication intermissions.
The Wheel is financially and editorially independent from the University. All of its content is generated by the Wheel’s more than 100 student staff members and contributing writers, and its printing costs are covered by profits from self-generated advertising sales.